
Tracking Player Stats using AI for Roundnet
A third look at sports analytics for the sport of roundnet.
By: Austin Ulfers
Published: November 8th, 2022
Preface:
Quite a lot has changed since my last update almost a year ago now. Over this past year, I have continually iterated on this application and am proud to say that I’m way farther than I could’ve imagined. Many design and engineering challenges I faced doubted me for sometimes months at a time but I’m happy to say that I’ve overcome them all. I’m excited to share this with you all and hope that you enjoy it as much as I do.
Background:
This application started as a spring break project in the middle of COVID (March 2020) after my plans for the week were cancelled. The goal is to create an analytics tool to support players and coaches in the sport of roundnet.
Previous Works:
So, where exactly did my last update leave off?
The last time I wrote about this project, I had the bare minimum for tracking relevant roundnet objects in a short video. Longer videos would continually build up memory until the application crashed and I was missing what is debatably the most important part of this project: the ability to track players. Unfortunately, between last year and this year, I have decided to no longer have the repository remain public. Given the tremendous amount of work that I have put in, I now have the desire to turn this technology into a product for everyone. However, I will continue to be as transparent here as possible without compromising my edge as to hopefully guide others who also have a strong passion for computer vision and showcase how it can be used to help build the society of the future!
Abstract:
Within this document, I will outline my near production ready infrastrucutre for tracking stats of players & teams in the sport of roundnet. This include combining the use of several computer vision models to track players, the ball, and the net. I will also include some of the challenges I faced and how I overcame them. Afterwards, I will discuss the current state of the application and what I plan to do next.
Introduction:
The video that I selected for my previous update was extrememly cherry picked to display some of the good results produced from the previous implementation. However, today I am going to showcase a (slightly less cherrypicked) example from a game with some of my friends at the Husky Roundnet Club. The players within this game did not know they actions were going to be analyzed. As we go through, I will show examples when this worked in my favor and also some examples of why some things might need to change for a production implementation.
I’m going to begin by showing some of the results and then from there, I will explain how I was able to achieve them.
Here is an example subset of an output video that can be generated by the application. The main thing to note about this video is that it does not contain all of the information that is being tracked. For example, in a later section of this update, I will go over how I managed to link different person_ids to the same player and why that was in some instances a good and others a bad idea.
If you would like to view the full game, please view it on YouTube here.
Here is also an example of some stats that are generated by the application along with some manually verified stats from the above video. The stats themselves are based off the pre-established formulas created by [1].
All numbers before the # are predicted stats, all after the # are actual.
"Player 1": {
      ...
      "Hitting RPR": 10.6,            # 17.1
      "Serving RPR": 17,              # 17.8
      "Defense RPR": 33.9,            # 16.7
      "Efficiency RPR": 20.0,         # 20
      "Ranked Player Rating": 128,    # 112.8
},
"Player 2": {
      ...
      "Hitting RPR": 13.3,            # 12
      "Serving RPR": 16.2,            # 10.5
      "Defense RPR": 10.7,            # 5.8
      "Efficiency RPR": 20,           # 18
      "Ranked Player Rating": 94.5,   # 72.8
},
"Player 3": {
      ...
      "Hitting RPR": 9.1,             # 16.7
      "Serving RPR": 10.7,            # 15
      "Defense RPR": 21.8,            # 7.7
      "Efficiency RPR": 20,           # 20
      "Ranked Player Rating": 96.8,   # 93.4
},
"Player 4": {
      ...
      "Hitting RPR": 8.9,             # 17.5
      "Serving RPR": 17.5,            # 10.5
      "Defense RPR": 42.7,            # 7
      "Efficiency RPR": 20,           # 18
      "Ranked Player Rating": 139.8,  # 83.4
}
So, after looking at the above stats, you might be saying that the generated stats aren’t at all close to accurate. Although this is true, given that this is the first implementation of stats, I will later describe what steps can be taken to greatly improve these results.
Methodology:
Inferencing:
Within this pipeline, I use two computer vision models. The first is the model I use for detecting the balls & nets and the second is for detecting the players and their poses.
Ball & Net Detection:
For the majority of this past year, I continued to use the Detectron2 implementation specified in the last update. However, within the past month, I have shifted to a custom trained YOLOv7 model [2]. YOLOv7 provided much more accurate predictions with faster inferecing times. This change alone allowed the application to go from ~3FPS to ~8FPS using my RTX 3070.
Player Detection:
For the player detection, I decided to go with the KAPAO model which is based off the YOLOv5 architecture that has been adapted to detect human poses [3]. Although there has been controversey surrounding the naming of the YOLO models, I went with KAPAO initally because of it’s fast inferecing time however, in the future, I could see myself migrating this to YOLOv7’s pose detection model.
Tracking:
However, inferencing is only a minor part of the battle. Being able to track objects between frames and then linking that to events in the game is the real challenge. For ball tracking, I decided to use my custom single active object tracking algorithm because it was safe to assume that there wouldn’t ever be more than one ball in play at a time during a game. For player tracking, I decided to go with a simple linear distance based tracking algorithm. As the videos have gotten more complex, I have found this algorithm to be less suffiecient and plan to work towards a non-linear multi-object tracking algorithm in the future like OC SORT which should be able to handle instances where a person leaves the screen and then re-enters [4]. My linear tracking algorithm has also struggled with ID switching which OC SORT should mitigate as well.
In order to group player ids together across the video, I had to make a couple of assumptions.
- There is only ever a maximum of four players with an bounding box area of 15000px or greater.
- All players in the video are apart of the game being recorded.
As you might expect these assumptions begin to break down when there are multiple games going on in one video and so thus player interference might occur. This player id grouping and linear multi person tracking algorithm ended up having a big negative impact on the accuracy of the stats. However, this should not be a surprise, if you are unable to correctly determine who is who, it is near impossible to determine who is doing what.
Significant Events:
Now that we ideally know where the active ball is and where the players are, we can start to make determinations as to the significant events of the actual game being played. After some initial thought, it was determined that the following three events would be required to know in order to generate the desired stats.
- When a hit occurs.
- When a serve starts.
- When a volley ends.
I knew that there has been some initial research on how to use LSTMs in computer vision to generate the likihood of events occuring in a video [5]. However, besides this example, I haven’t seen this technique used widely outside of academia and I knew that trying to implement an LSTM ontop of what I already had would be too big of a hurdle considering I didn't know how to do that. So, to start, I decided to focus on simpler solutions.
When a hit occurs:
This was the first obstacle I wanted to tackle because at the time, it was the only one I had any remote idea of how to solve. I knew that if I seperated the X and Y components of the active ball across the frames, that I could get a rough idea of when the direction of the ball was interupted.
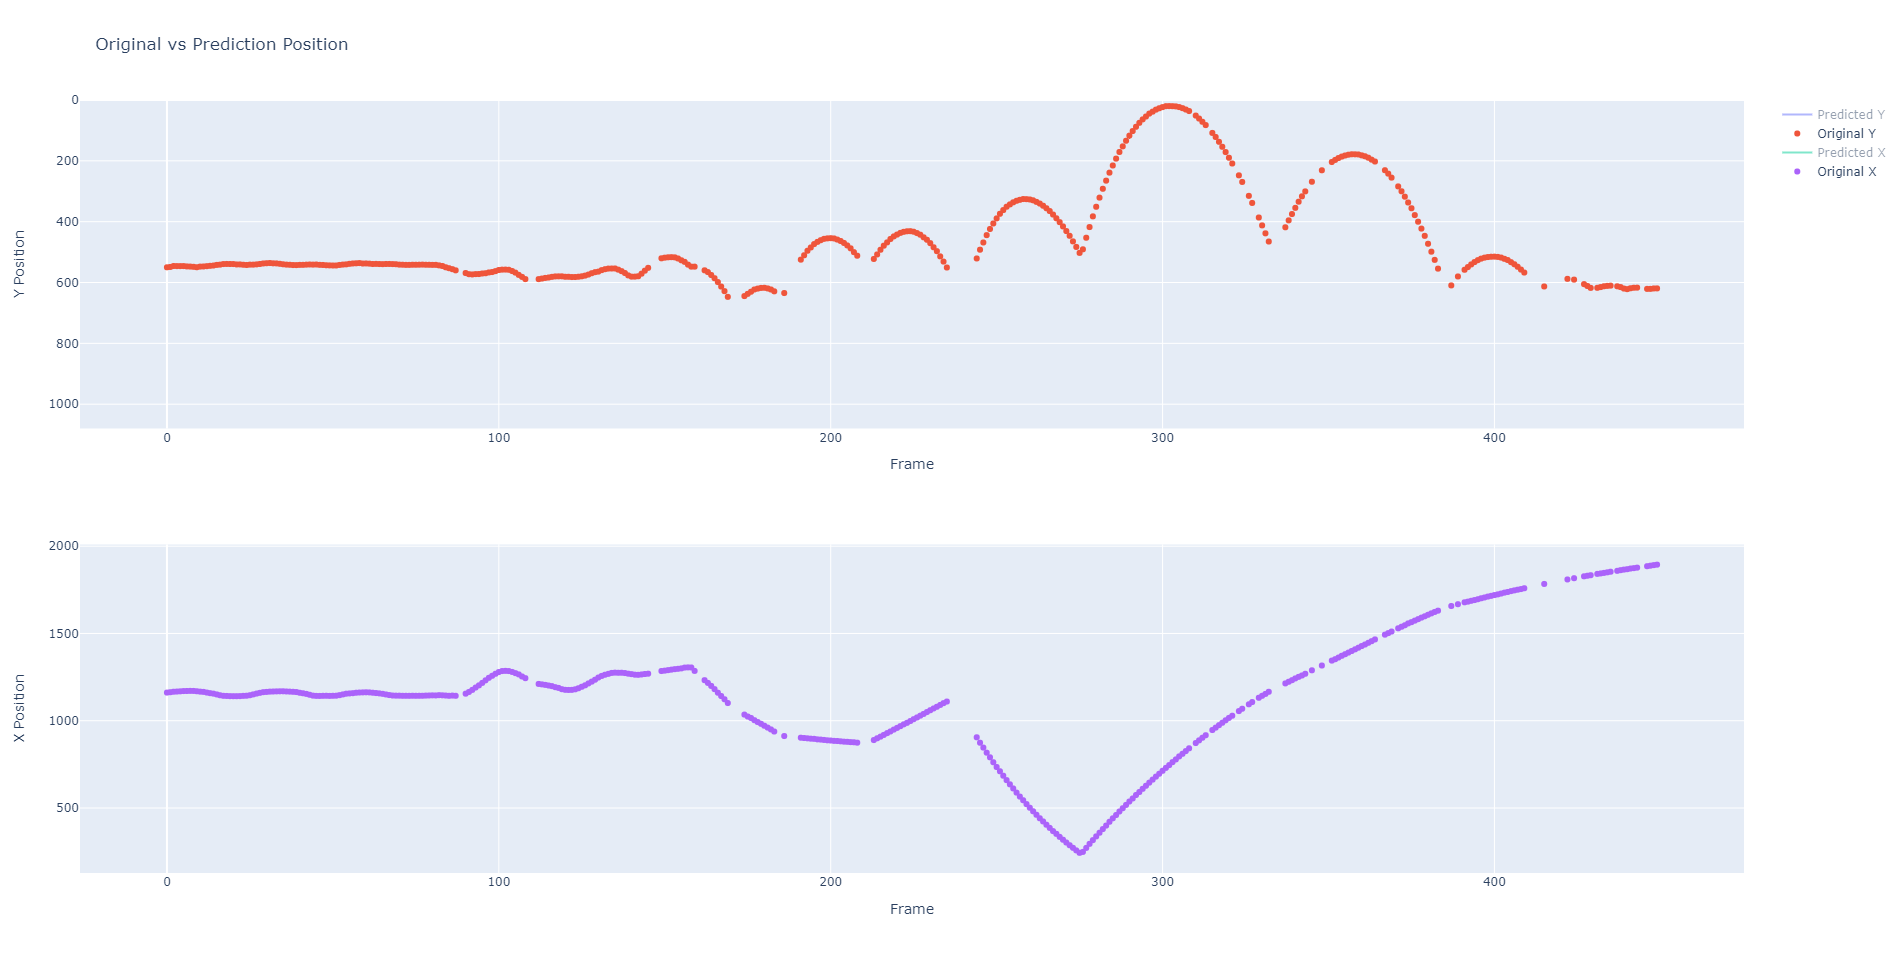
However, I first needed to fill in spots where inferencing failed. To do this, I used pandas interpolate function [6].
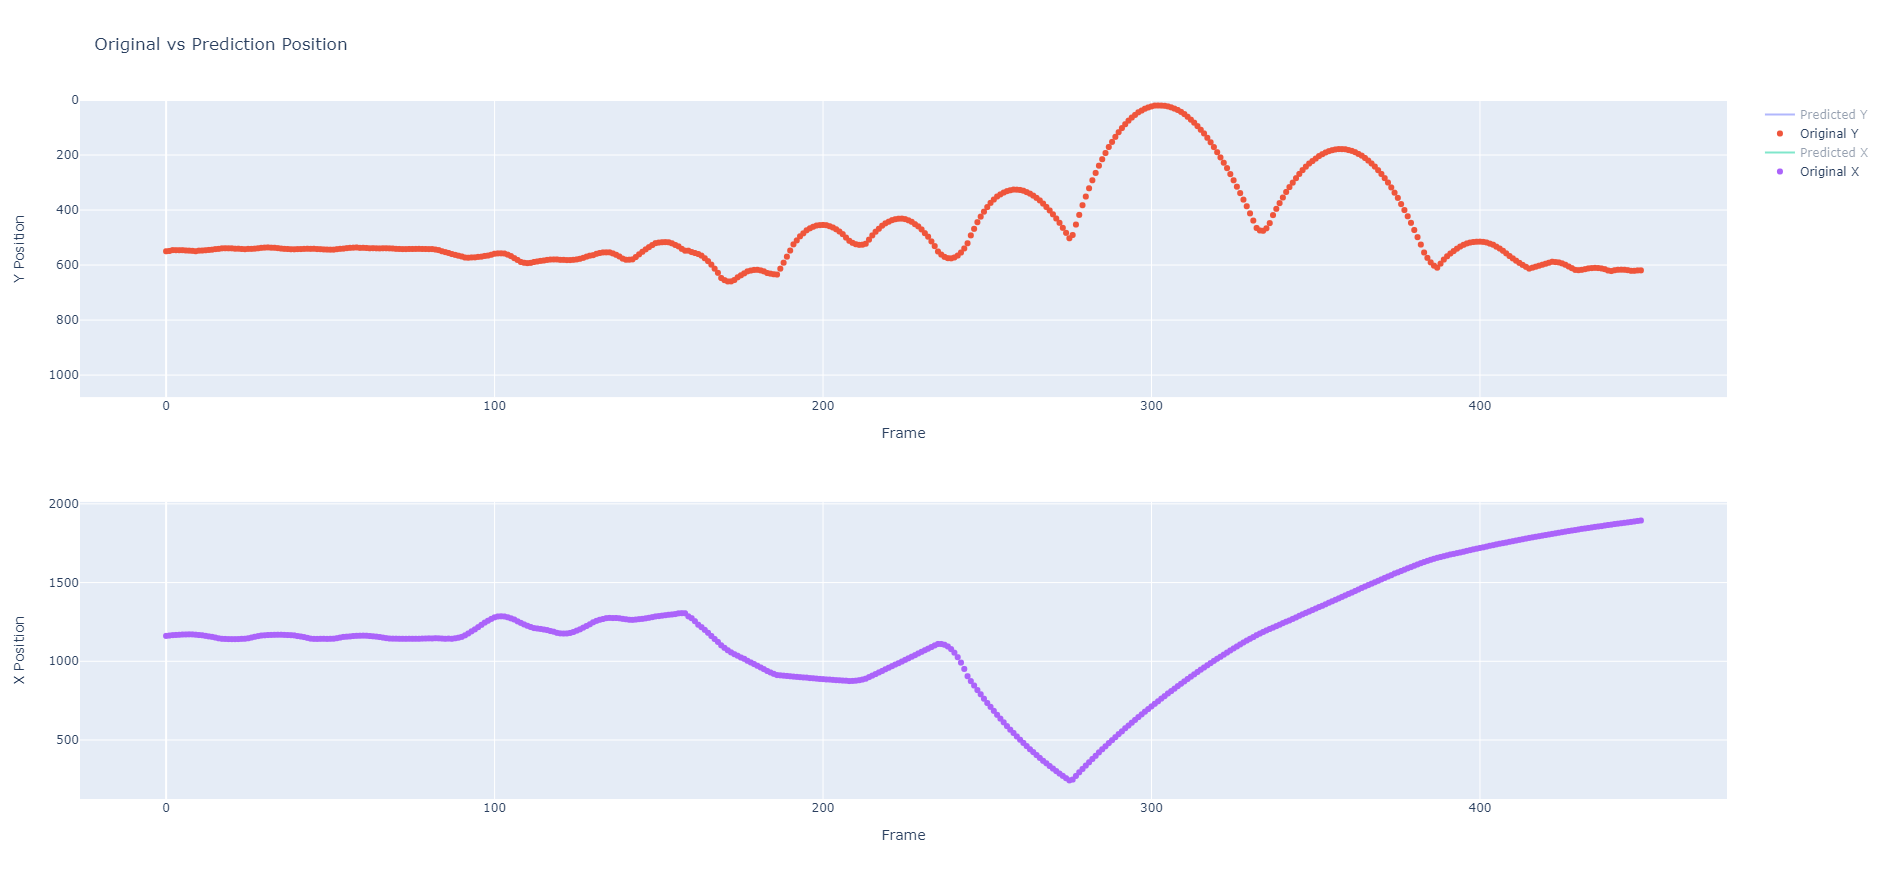
From there, I could determine when those interuptions occur and label them as hits. All I needed to do was exclude the marked hits that occured above a net because for those, we can assume that the ball was just bouncing off the net. In addition, once we know when a serve starts, we could also ignore any marked hits that occured before the serve started. To find these interuptions, I used scipy’s find_peaks function and added some manual thresholding to minimize false negative predictions [7].

The above example goes ahead in time a bit because it already has the serve and end marked so the only interuptions displayed by the black lines are the hits that aren’t on the net, before the serve, or after the volley has ended.

This method overall is fairly decent considering how little effort it was to implement. Although it isn’t perfect and false positives and negatives do exist on analysis, it is a good starting point. The only hits that consistenly get missed are the ones where the direction the ball is traveling continues in the same direction for the player who hit it because in this scenario, there is no marked change in the x or y direction. I might be able to do something with checking for a speed increase but I have a feeling the dataset is too noisy to distinguish that.
When it comes to ownership of a hit, I use the wrist datapoints generated from the pose model to guess who was closest to the ball at the time of the hit.
When a volley starts and ends:
Trying to determine when a volley started and ended turned out to be one of the hardest challenges I’ve faced over this past year. Since I didn’t have the ability to know when a ball hit the ground, I had no determinate way to know when a volley ended. This similarly made finding when a volley starts difficult as well. Essentially, all I had to work with was that I knew when a ball was hit and when a ball was over the net. Since ocassionally balls would hit the net inbetween volleys and players would sometimes pass the ball to eachother using the net, this wasn’t a guaranteed method.
After months of deliberation, I decided on a time based approach for determining when the volley ends. Essentially if a ball doesn’t make it back to the net in X amount of time, we can assume the volley died. The downside of this approach is that it is a manual threshold and that it means we lose track of all hits that might have occured after the last ball left the net. The specfic stats that get impacted from this are when a receiver is Aced and on the last Defensive Hit.
Finding the start of the volleys was much more difficult however, I ended up with an imperfect solution that relies on observed competitive player cadences during games. Once I had the start of each volley, this also allowed me to determine who was serving which I assigned to whoever’s hand was closest to the ball the longest before the ball is served.
Unfortunately, these areas are ones that I currently don’t have a good suggestion for how to improve. There might be something using LSTMs as stated above but I am open to suggestions if anyone has any ideas.
Aggregating Stats:
Now that we have the significant events, we can start to aggregate the stats. The first step is to determine which players are paired on the same team. This is needed because the stats for Breaks and Broken are determined based on if the server ends up winning or losing the volley. For this, I actually pulled out a throwback to my University level computer science data structures and algorithms class and found that the graph data structure was perfect for what I was looking for. As shown below, I utilized a weighted complete graph to simulate the possible relationships between different players [8]. We were able to assume that players had to serve to the opposite teams so we used that to help determine who was on opposite teams. Using this graph structure allowed me to solve a maximum weight matching problem to derive the team assignments [9].
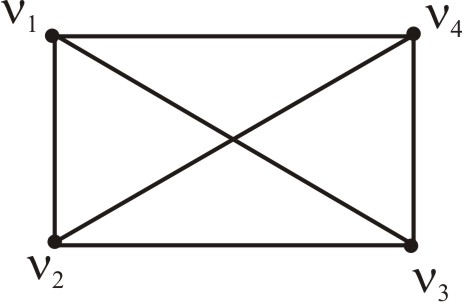
After this, it was just a matter of aggregating all the stats together per player and packaging them up for use in a readable format.
AWS Infrastructure:
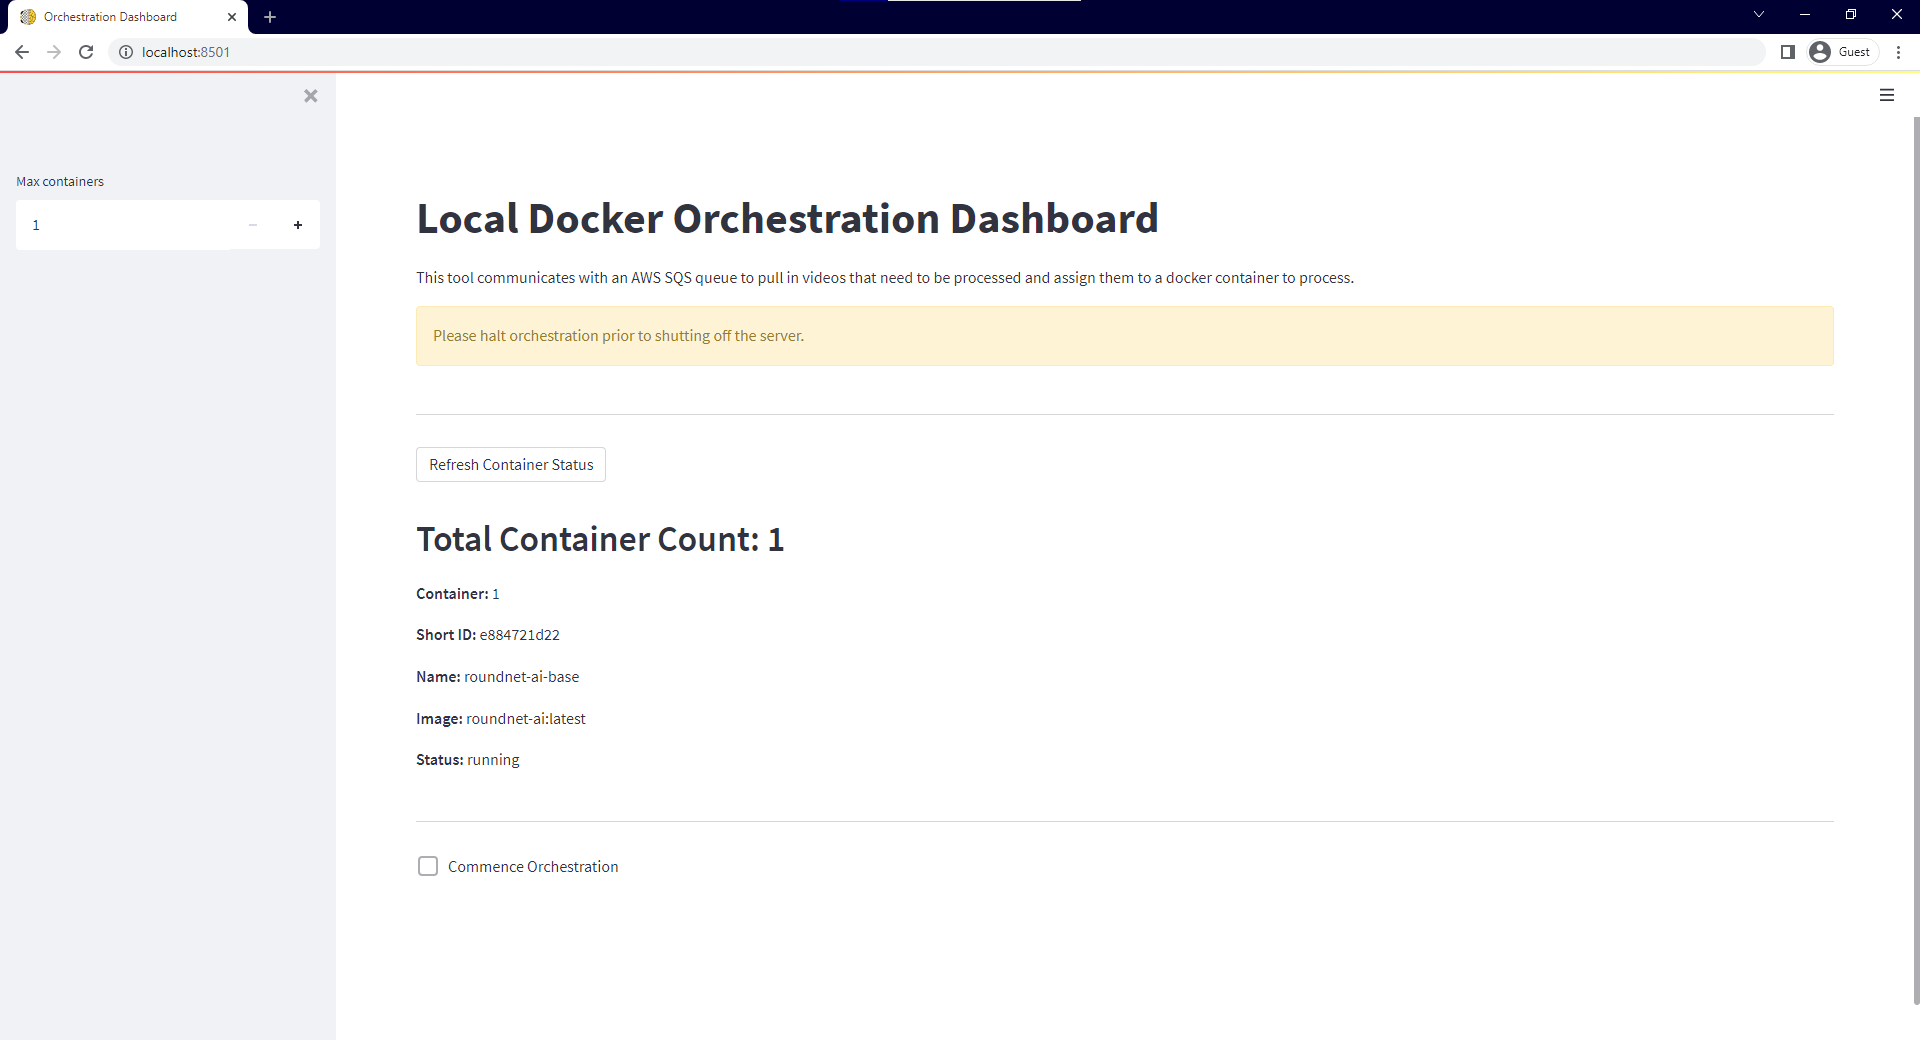
Now, lets say I want the ability to use this application from the field. I setup a local docker orchestration tool that can run containers of this application locally and then send the information up to the cloud. This utilizes Streamlit and Docker’s python SDK and is basically a poor man’s Fargate. Since at this time I have a small enough use case where my computer’s compute power is enough, I have no need to pay for compute which drastically reduces my potential infrastructure cost. In total, the following setup costs me penies per month which is huge considering I can now run the orchestrator whenever I want and then upload videos from my phone remotely from anywhere. A screenshot of the docker orchestration tool is below.
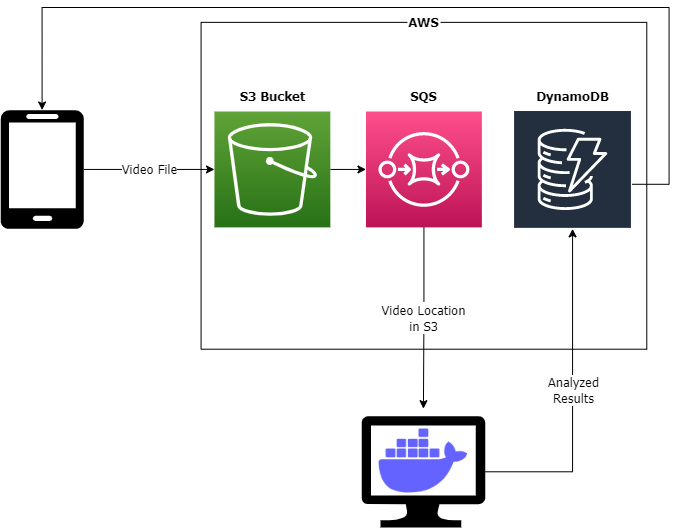
Below is the current AWS infrastructure used to allow this whole process to occur.
Suggestions:
- Use YOLOv7 pose for player detection for potentially faster inferencing.
- Use OC SORT for player tracking to reduce chances of id mislabeling and swapping.
- Implement a better hit detection algorithm, potentially using an LSTM.
Future Plans:
Over the past year, I have had a lot of time to think about what I should do next. Part of me really wants to continue down the path of improving the stats analysis through the suggestions outlined above, however, if I were to take a look at this project from a business sense, I think that path is guiding me towards a different path.
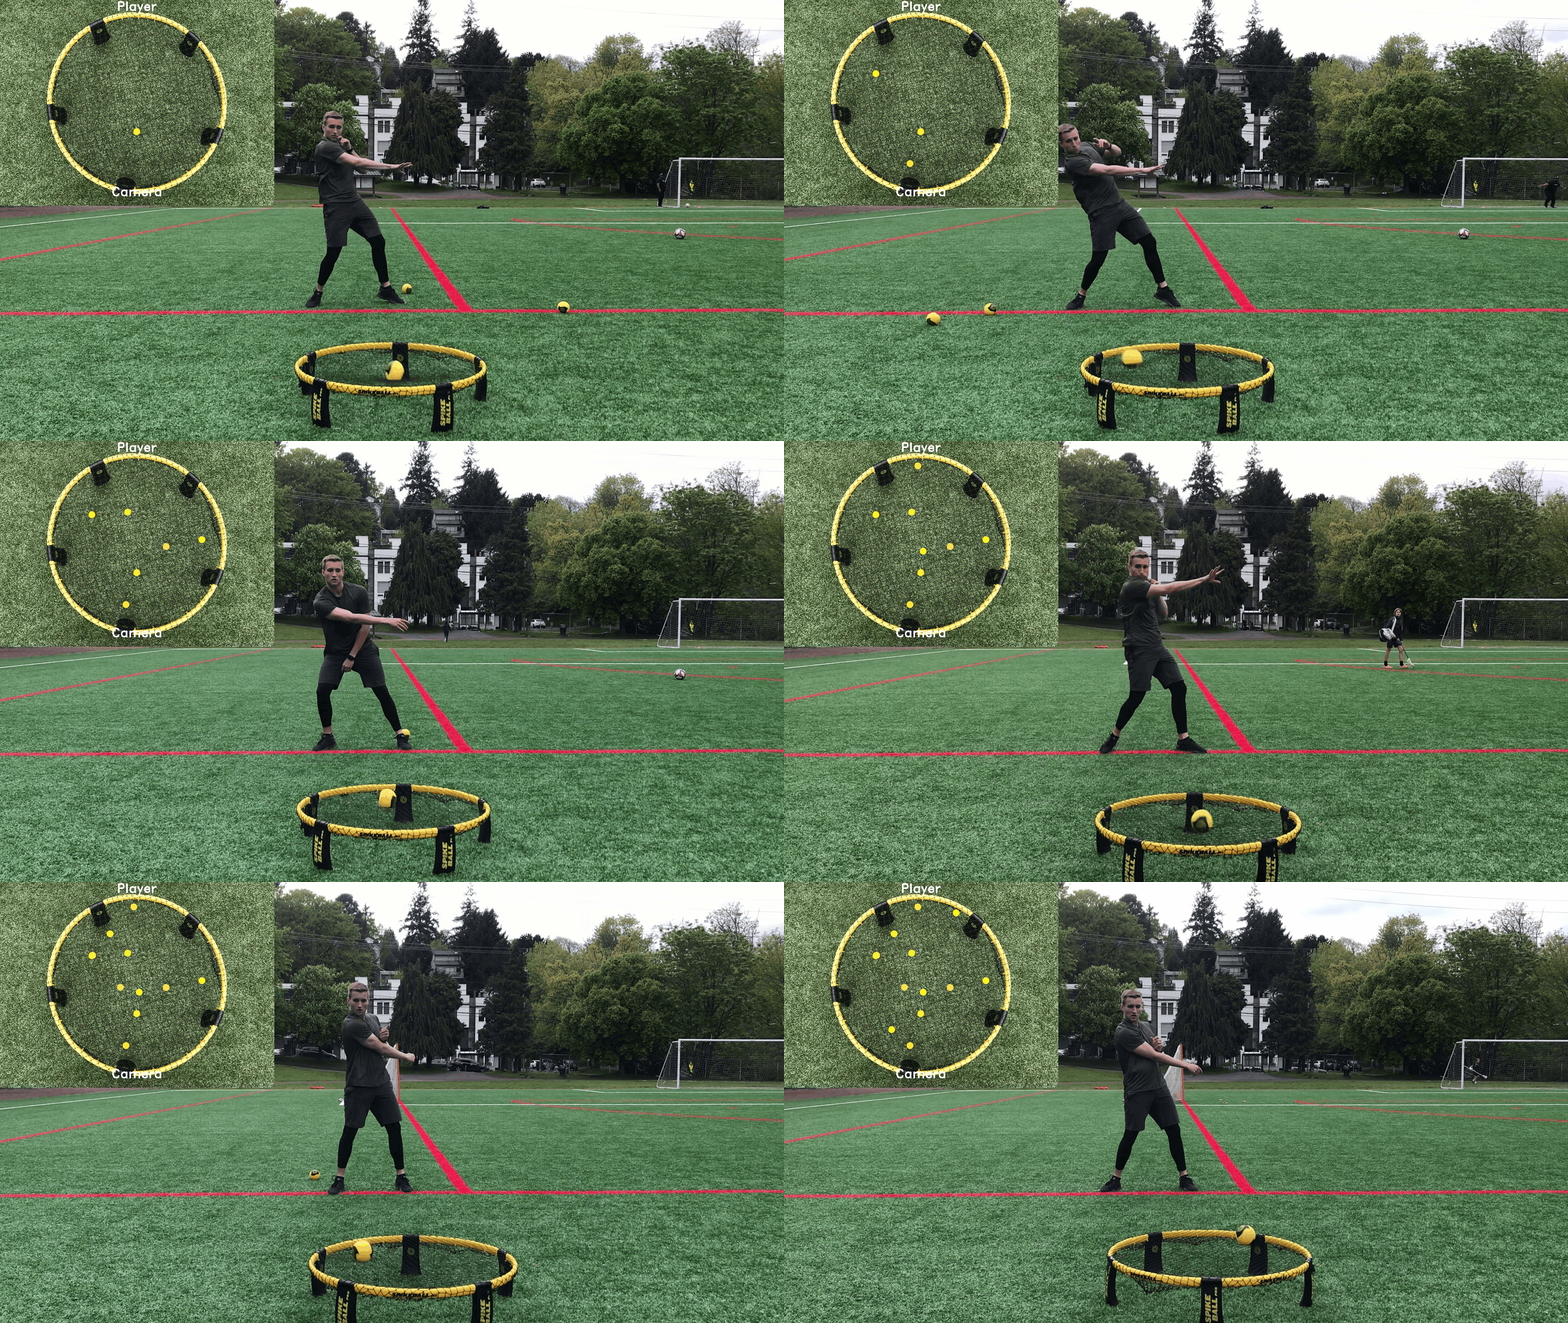
At some point over the past year, I took a step back and asked myself: What would this application need in order for me personally to be willing to pay for it? The conclusion I came to was that stats are nice but they don’t actually help contribute anything to my game besides being able to more easily say “I’m better than you. Statsically, speaking.” While that is great and all, I think for a majority of players, if this tool could be leveraged to be able to improve their game, I think that in itself would have a much higher value ceiling than just stats. Looking at the competitve scene today, it is easy to tell that the outcome of many games rely heavily on the reliability of each player’s serve arsenal. Given this, from a business perspective, now that this stats proof of concept has been flushed out. I think the next step that makes the most sense from a business perspective would be to use the technology created here to help players improve their serve. Although there would be a lot more to flesh out there, I could see the player poses being used to help with serve stances and the ball tracking being used to help with server placement.
Here is a sneak peak at how an AI assisted training tool might look like in the future.
This setup works extremely well for my requirements at this stage. I can upload videos at any time or have users have the ability to upload videos at any time and have a queue of messages in SQS waiting for my docker orchestration to commence and actually run the analysis. If this project were to scale larger, at some point, I would need to replace my local computer with cloud infrastructure but I'll cross that bridge once/if I get there.
Postface:
You can now follow Roundnet AI on the following social media platforms (None of which are active quite yet):
https://www.instagram.com/roundnet.ai/
https://www.facebook.com/RoundnetAI/
https://twitter.com/roundnetai
References
- Stat Definitions Glossary
- YOLOv7: Trainable bag-of-freebies sets new state-of-the-art for real-time object detectors
- Rethinking Keypoint Representations: Modeling Keypoints and Poses as Objects for Multi-Person Human Pose Estimation
- Observation-Centric SORT: Rethinking SORT for Robust Multi-Object Tracking
- GolfDB: A Video Database for Golf Swing Sequencing
- pandas.DataFrame.interpolate
- scipy.signal.find_peaks
- Complete Graph
- Maximum Weight Matching